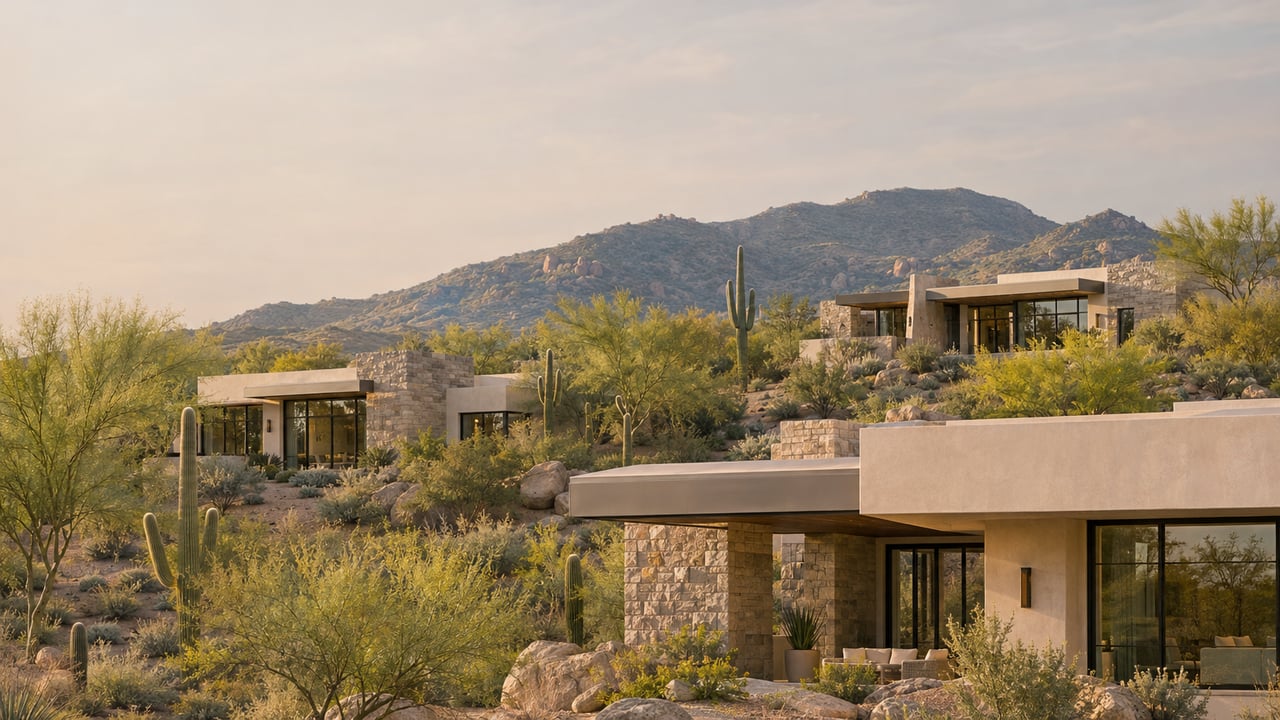
Reading North Scottsdale's 85255 and 85262 Market Numbers Before Season
November 19, 2026
November 19, 2026
In October 2026, the median price of a single-family home sold in ZIP code 85262 rose 29.4 percent from October 2025, to $1,537,500. In the same month, days on market until sale there reached 154, 43 days longer than a year earlier, and pending sales fell from 34 to 20. The 29.4 percent figure says prices are running. The 154 days and the drop in pending sales say demand is slowing. One month's report contains both, and only the slow-demand figures describe the market a buyer meets this winter.
Next door in 85255, the headline points the same misleading way. Single-family inventory fell 19.1 percent year over year, and months of supply fell from 4.9 to 3.6. That reads like a tight market. Underneath it, pending sales fell by nearly half.
In both ZIP codes, October's most-quoted figure looks like strength, and the figure that predicts the next few months points toward buyers.
A median is only the middle sale in a small group, and in 85262 the group is small. The ZIP code closed 38 single-family sales in October 2026 and 37 in October 2025. With samples that size, a few large closings in one month can move the median a long way.
The October 2025 median, $1,187,865, was unusually low for this ZIP code. The year-to-date median through October 2025 was $1,535,000, so last October's middle sale came in well below the year's typical home. Most of the 29.4 percent gain comes from measuring against that soft base. The longer view is calmer. Year to date through October 2026, the 85262 median is $1,610,000, up 4.9 percent from the same period in 2025. The average sale price shows the same mix effect. It rose 40 percent in October alone and 3.6 percent year to date. The report notes under its own table that its percent changes "can sometimes look extreme due to small sample size."
What the October 2026 report does show is how long sales are taking. Days on market until sale stood at 132 for the year through October 2026, up from 113 a year earlier. Inventory held at 289 homes, and months of supply rose to 7.1. The 85262 market is selling at roughly the prices it got last year, and it is taking longer to do it.
In 85255, inventory fell by 63 homes year over year, from 330 to 267. Buyers did not absorb those homes. New single-family listings fell from 130 in October 2025 to 86 in October 2026, a drop of 33.8 percent. Fewer owners put homes on the market, and that alone pulled inventory down.
Pending sales fell faster. They dropped from 67 to 35 in October, a decline of 47.8 percent. Months of supply compares the homes on the market with the pace of recent sales. The 3.6-month figure still reflects a year in which 85255 closed 790 single-family sales through October, up 12.9 percent. That works out to roughly 79 closings a month. If buyers kept October's pace of 35 new contracts, the same 267 homes would take more than seven months to sell. One month is a short window, and a single October does not set a trend. Still, the drop in contracts is measured against October 2025, so the seasonal calendar does not explain it.
Prices in 85255 have held up. The October median was $1,820,000, up 17.4 percent, and the year-to-date median was $1,732,500, up 9.5 percent. Days on market until sale was 81, compared with 80 a year earlier. These are the figures of a market whose sellers are holding firm. The pending count shows fewer buyers agreeing with them.
All figures are for single-family homes in October 2026 compared with October 2025, from the Phoenix REALTORS® Local Market Updates built on ARMLS data current as of November 3, 2026.
| Metric, October 2026 | 85255 | 85262 | 85266 |
|---|---|---|---|
| Homes for sale | 267, down 19.1% | 289, up 2.1% | 144, up 3.6% |
| Months of supply | 3.6 | 7.1 | 5.4 |
| Days on market until sale | 81 | 154 | 77 |
| Percent of list price received | 96.3% | 96.0% | 96.1% |
| Pending sales vs. Oct. 2025 | 35 vs. 67 | 20 vs. 34 | 9 vs. 33 |
| Median sale price | $1,820,000 | $1,537,500 | $1,650,000 |
Percent of list price received is the steadiest row in the table. Sellers in all three ZIP codes are closing at about 96 percent of list. The slowdown shows up in time on market and in the number of buyers signing contracts, and 85266 shows it most sharply, with pending sales down from 33 to 9. It has not yet shown up in the discount on the homes that do sell. The full reports for 85255, 85262 and 85266 are public through Phoenix REALTORS®.
North Scottsdale is moving inside a wider market that has shifted quickly. The Cromford Report says its Cromford® Market Index for the whole Phoenix-area market fell to 69.9 on October 21, its first reading below 70 since March 12, 2009. Cromford treats any reading below 90 as favoring buyers. In its early-November market summary, Cromford reported that supply rose faster than it did last fall, that contract activity fell, and that its contract ratio was at its lowest level since February 2009.
Scottsdale as a whole is following the same pattern. The Scottsdale REALTORS® October 2026 report counts all residential property types together. It shows 5.45 months of inventory, up 11.22 percent from September, and a median of 50 days on market, up 28.57 percent. Active listings citywide reached 2,711 at the end of October, up 7.2 percent in a month.
Cromford's longer-term research adds one more factor. Comparing 53 neighborhoods on price per square foot for detached homes in the 12 months to August 2026 against the 12 months to August 2023, Cromford found that expensive homes near the center of the Phoenix area gained much more than expensive homes on the fringes. The outer ZIP code shows the slower year-to-date price gain here too: 4.9 percent in 85262, compared with 9.5 percent in 85255, for January through October 2026.
ZIP 85255 includes DC Ranch, whose Ranch Office is at 18867 N Thompson Peak Parkway and whose community centers are on E Desert Camp Drive and N 98th Street. It also includes Windgate Ranch, a gated community on E Windgate Ranch Road. Resale is what 85255 sells, so when owners there stop listing, the supply of homes shrinks right away.
ZIP 85262 runs north into Mirabel, whose club is at 37100 N Mirabel Club Drive, and Desert Mountain. Resale homes in 85262 also compete with new construction. Within Desert Mountain, Camelot Homes is building The Villas II, the second phase of its Seven community, with 23 home sites that all back to the No. 7 course. Its published plan prices are $2,429,900 and $2,449,900, and its model is open. Elsewhere in North Scottsdale, Shea's Reserves at Storyrock lists six homes remaining from $2,924,499. Shea expects two of them to be finished in December and three in spring 2027. A resale seller in 85262 is often competing for the same buyer as a builder who can set a completion date, and that buyer can afford to take time to decide.
The October reports show where the room for negotiation sits. With homes still selling at about 96 percent of list, a buyer is unlikely to find it in a large headline discount. It is more likely to show up as time and terms. A home in 85262 that has sat past October's 154-day figure is up against a calendar that its seller can see as clearly as the buyer can. In 85255, the room comes from the drop in contracts. Sellers there priced their homes in a year of 790 closings, and October's buyers signed contracts at half the pace of a year earlier.
For sellers, October's report reads in reverse. An owner in 85255 who sees 3.6 months of supply may expect a fast season, but the pending figures suggest otherwise. An owner in 85262 who sees a 29.4 percent median gain is looking at a base effect. The 4.9 percent year-to-date figure and the 132-day year-to-date time on market are the better guide to pricing.
On supply alone, it is tighter than the city, with 3.6 months against Scottsdale's citywide 5.45 in October 2026. The drop in pending sales, from 67 in October 2025 to 35 in October 2026, is the figure to watch through the winter.
It compares only the October 2025 and October 2026 medians, on fewer than 40 sales each. The median for January through October 2026 is up 4.9 percent.
The Phoenix REALTORS® report for the Town of Paradise Valley shows 7.1 months of supply and 85 days to sale in October 2026. Its single-family median was $5,300,000, up 20.5 percent from October 2025. Its supply equals 85262's, while its homes sell in about half the time.
If you are weighing a purchase in 85255 or 85262 this season, or deciding how to price a home you own in either ZIP code, Allison Cahill can go through the current pending and days-on-market figures for your community before you set a price or write an offer. Schedule a confidential consultation to start with the numbers from your part of North Scottsdale.
Detail-oriented, Cahill has a passion for studying the market and educating clients about current conditions, inventory and trends. “I take my time with each client and listen to what they want,” she says. “My sellers like that I truly market their properties on all social media platforms and print publications, with the use of not only photography, but also video, drone and 3D-style tours of their homes.”